Explore ortholog search results
Note
Data availability for this tutorial: the three group files used in this tutorial can be downloaded here
Load group files
Note
There are three ways of loading data in TriFusion. Here we’ll use the file browser.
The input data of the Explore operation of the Orthology module are the group files that are generated at the end of the ortholog search operation. These are simple text files that contain the definition of an ortholog group in each line. A typical group file should start with something like:
Ortholog1: Afumigatus_proteins|433 Anidulans_proteins|4605 (...)
Ortholog2: Afumigatus_proteins|3278 Afumigatus_proteins|9183 (...)
Ortholog3: Anidulans_proteins|36 Anidulans_proteins|9893 (...)
(...)
If you are loading group files from previous ortholog search runs, they will be found inside the specified output directory, in the Orthology_results directory.
To load the data, navigate to the Orthology screen and click the
Explore operation on the left of the screen. Then click the + button
on the top left of the screen to open the file browser. Navigate to the
directory containing the group files and then select files. In this
case, we will select the three group files generated in a previous search
operation that was performed with inflation values 2, 3 and 4.
The orthology explore screen
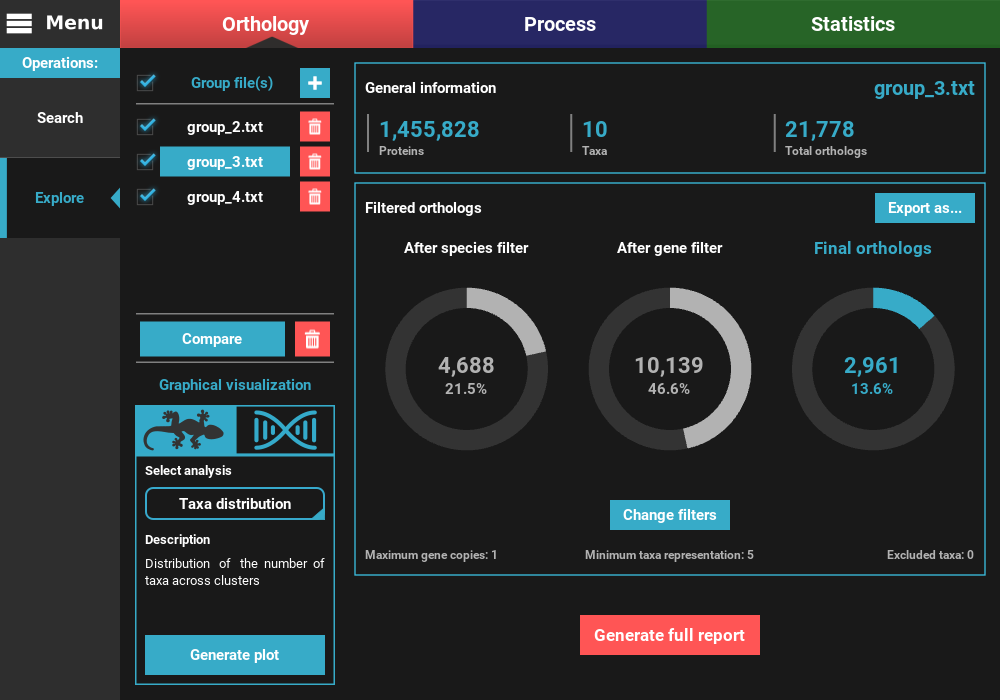
Once the group files are loaded into TriFusion, several descriptive statistics will populate the screen.
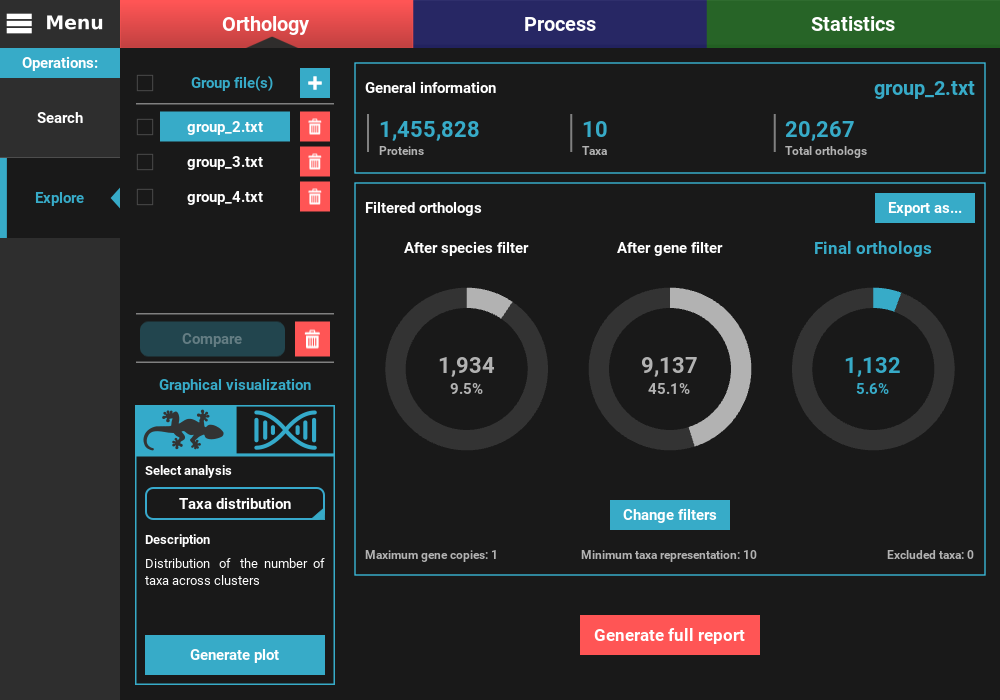
To the left, the loaded group files are listed under the Group file(s) section, where they can be selected to visualize the statistics specific to that group. They can also be removed by clicking the trash bin red button.

On the remaining of the screen, general statistics and information on the filtered orthologs are presented for the currently selected group file. The General information section informs the total number of proteins, taxa and ortholog groups contained in the group file.

Below, in the Filtered orthologs section, the number of orthologs after applying the filters is displayed in gaussian plots. The values displayed are for the default ortholog filters, wich are set to single copy genes (maximum gene copies of 1) and with all taxa present (minimum number of taxa equal to the number of taxa).

In our case, we can see that the group_2.txt file contains around 1.5M proteins for 10 taxa, clustered in 20k ortholog groups. From these 20k ortholog groups, 1 934 passed the species filter (minimum number of taxa), 9 137 passed the gene filter (maximum number of gene copies) and 1 132 passed both filters. This indicates that the species filter is the major limiting factor in the final number of ortholog groups.
Change the active group
To change the active group file, simply click the group button in the Group file(s) list section in the top left of the screen. Let’s change the active group file to the group_3.txt file.
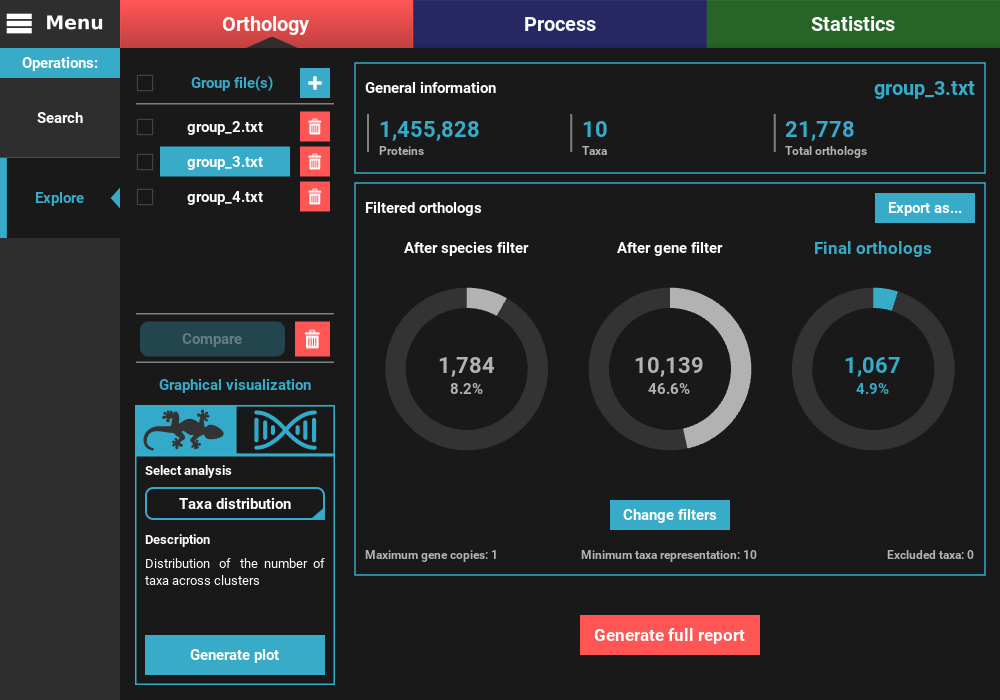
As you can see, the numbers of total and filtered ortholog groups changed slightly, which is a result from using different inflation values during the search operation.
Change the orthology filters
A common procedure during the exploration of the orthology search results
is the modification of the ortholog filters. To change the filters,
click the Change filters button in the bottom of the
Filtered orthologs section. This will open the ortholog filters
dialog where you can change the maximum number of gene copies,
minimum number of taxa for the ortholog groups and exclude/include taxa
from the ortholog groups. Let’s maintain the gene copy filter and only allow
for single copy genes, but relax the minimum number of taxa to half of the
data set (5). The Apply filter to all group files check box will also
remain active to update all group files with the new filter. When all filters
are set, click the Ok button to update.

After the application of the new filters, you can see that the number of filtered orthologs changes. The number of final orthologs for the group_3.txt file almost tripled when we relaxed the number of minimum taxa per ortholog group. You can also see that the filter values were updated at the bottom of the Filtered orthologs section.
Compare group files
To easily compare the number of total and filtered ortholog groups among
different group files, you can check the boxes to the left of the group files
in the Group file(s) list section. To select/deselect all group files, you
can also check the top checkbox. Here, let’s compare all group files by
selecting all and then clicking on the Compare button.
This will bring you to a plotting screen, where a bar plot will be displayed with the number of total and filtered ortholog groups for each group file. You can interact with the plot by pressing the left mouse button and dragging the plot. You can also zoom in and out using Ctrl + mouse wheel or by clicking the corresponding buttons on the right side panel.
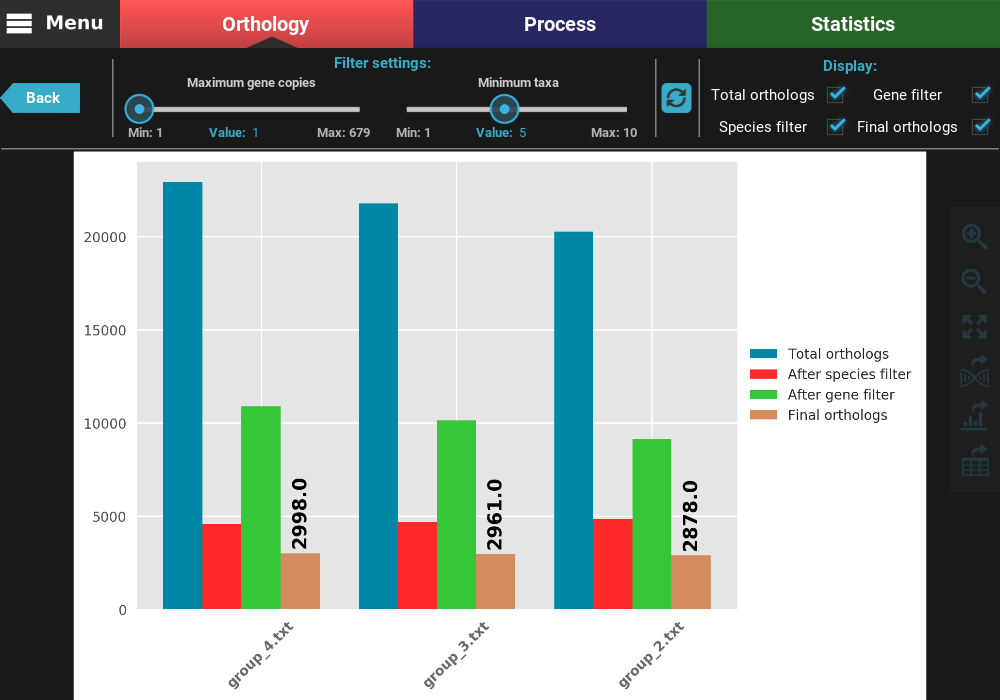
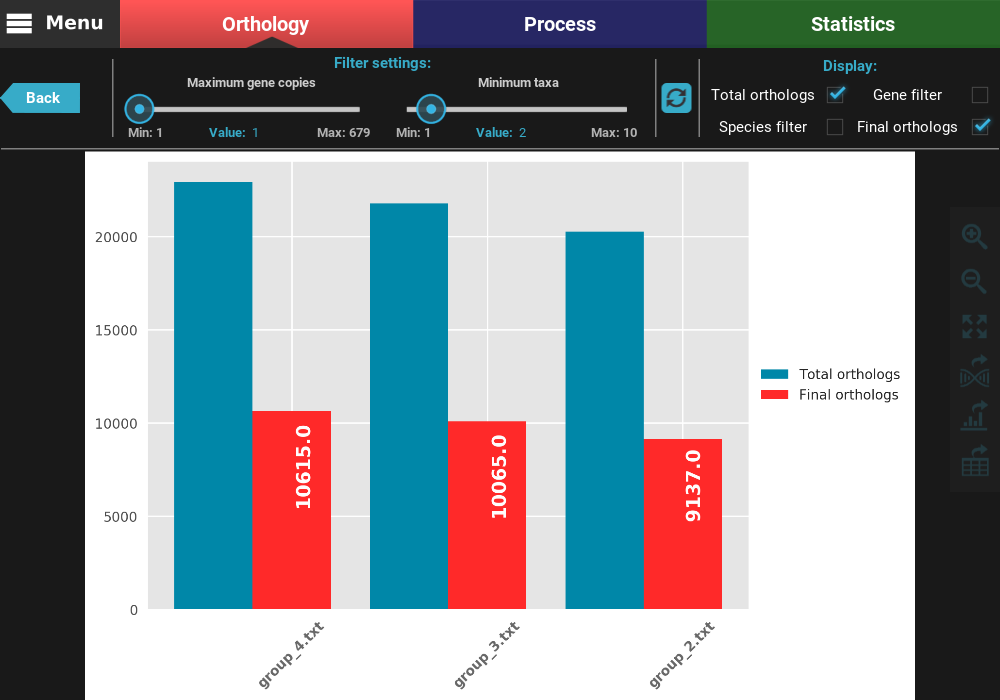
At the top of the screen, you can see the currently active filters, which are the same we set in the previous section. Note if taxa were excluded previously for the active group file, those taxa will also be excluded here. You can change the filter values using the sliders. Let’s try to relax even further the minimum number of taxa to 2. After changing the slider value (or changing the “Value” number), you can see that the refresh button turned red, which means that you have set different filter. To update the plot, click the refresh button.
After clicking the refresh button, the plot values will be updated. You can see now that the total number of orthologs is almost 10k for all group files and that there is almost no different between the gene filtered and final ortholog groups. Indeed, we can see that the final number of orthologs does not deviate much between group files (range between 9 137 and 10 615).
You can also change which type of ortholog groups are displayed by ticking the check boxes in the Display section on the top right of the screen. Let’s visualize only the total and final number of orthologs. To accomplish this, uncheck the Gene filter and Species filter boxes.
At any time, you can export the current plot in figure or table format by
clicking the Export as graphics or Export as table buttons,
respectively, in the right side panel.
Graphical visualization of group files
Individual group files can also be further visually explored using the
plotting tools under the Graphical visualization section in the
bottom left of the screen. Graphical visualization options are sorted
into Species focused exploration and Ortholog focused exploration.
Clicking on either option will present a drop down menu where specific
plotting options are available. When one of these options is selected,
a short description is shown below. Let’s investigate the taxa coverage
of the currently active group file, by selecting the Species focused
exploration and the Taxa coverage plot option. Then, click on the
Generate plot button.

This will open a plot screen akin to the one displayed when comparing different group files. In this specific plot you can see, for each taxa, the proportion of ortholog groups where they are present (dark blue) or missing (light blue). In the top right of the screen, under the Summary section, you can see the total (red) and filtered (green) number of ortholog groups and taxa that are being used to generated the plot. In this case, a total of 21 777 ortholog groups across 10 taxa are being used. As you can see, by default, all plotting options will set the filters to their most relaxed values (allowing for all gene copy numbers and any taxa representation).
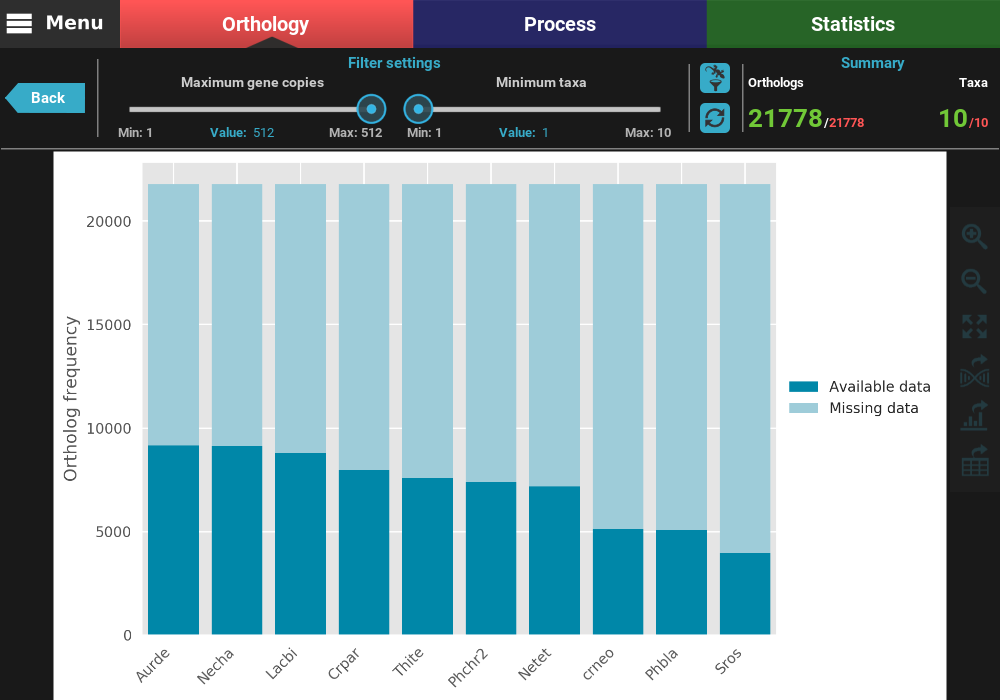
The plot can be interacted with by clicking and dragging and by zooming in and out. In the header of the screen, the ortholog filters can be changed. Let’s change the filter setting so that only single copy genes with at least 5 taxa represented are considered. When the filters are modified, the refresh button should turn red and must be clicked in order to update the plot.
After the plot is updated, you can see that the values in the Summary
section of the header have also updated. This plot is now being generated
with 2 691 ortholog groups across 10 taxa. We can also see that, using
these filter values, all taxa have a pretty decent proportion of available
data. However, you have also the option to remove specific taxa
from this analyses, by clicking the filter taxa button in the header
above the refresh button. Clicking this button will display all taxa listed.
These can be toggled in or out by clicking the respective buttons. For
exampled, let’s remove the last two taxa, Thite and crneo, by
clicking them once.
As you can see, the bars of the removed taxa are no longer in the plot and the numbers in the Summary section of the header were updated to 8 active taxa.
As in the compare groups plot screen, all plots in the
Graphical visualization section can be exported into figures or
table formats by clicking the Export as graphics or Export as table
buttons, respectively. The filtered ortholog groups can also be exported
to a new groups file, to protein or nucleotide sequences, by clicking the
Export group button (see Export ortholog groups as protein or nucleotide sequences).
Generation of full report for single groups
All plotting options in the Graphic visualization section can be
automatically generated into a HTML file by clicking the
Generate full report button at the bottom of the Explore screen.
Then select the directory where the report will be generated. In that
directory, an HTML file will be created where all plots will be visualized
for the currently set ortholog filters.