Summary statistics
Note
Data availability for this tutorial: the medium sized data set of 614 genes and 48 taxa that will be used can be downloaded here.
Summary statistics overview
As soon as you load your data into TriFusion and navigate to the Statistics module, the computation of general and gene specific summary statistics will start. This computation is being done in the background, and unless you start to generate a plot or load more data into TriFusion, it will continue to do so. When finished, a summary statistic overview for the currently active data set will be displayed in the Statistics screen.
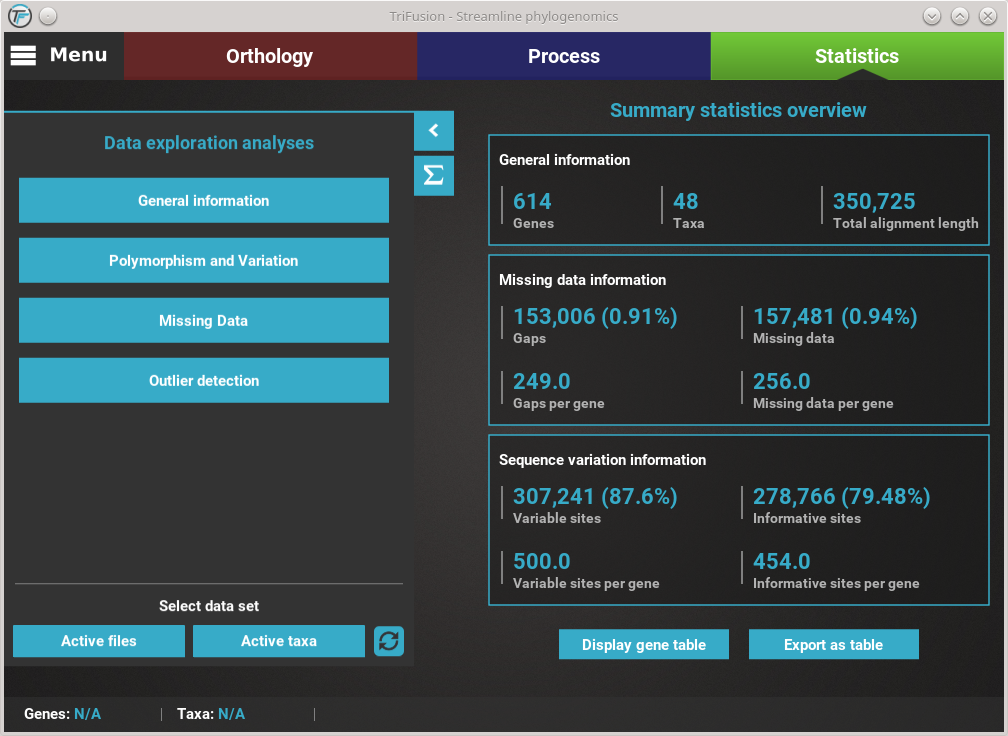
Information is sorted in three main cateagories: General, Missing data and Sequence variation.
The values in the General section are mostly self-explanatory. We only note that the Total alignment length refers to the length of the alignment as a whole, not the sum of each sequence in the alignment.
The Missing data section separates the role of gaps (usually denoted by “-” in the alignment file) and true missing data (usually “N” in nucleotide sequences and “X” in protein sequences). The Gaps and Missing data values refer to the total number of gaps or missing data across all sequences, not alignment columns. Therefore,the associated percentages provide the relationship between these values and the sum of total characters in the alignment (in this case, 48 * 350 725).
The Sequence variation section provides the number of variable (at least one variant) and informative (one of the variants must be represented at least in two taxa) sites across the data set. In this case, these values correspond to the number of alignment columns, so percentages are relative to the Total alignment length.
Gene specific summary statistics
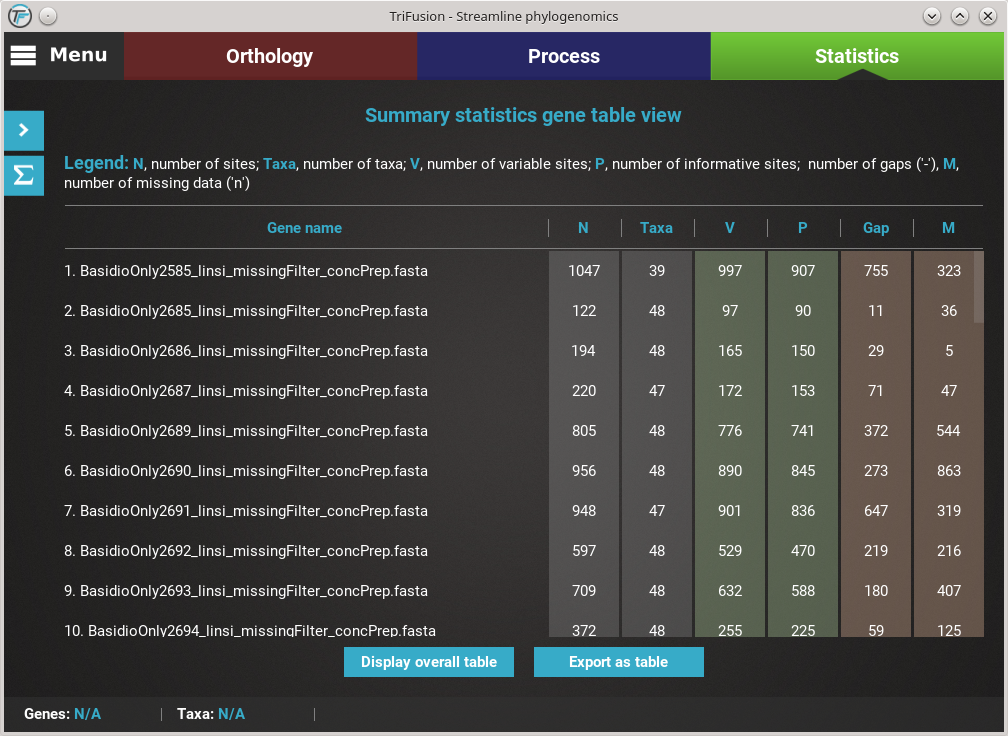
To visualize the same statistics as in the previous section
discriminated for each alignment file, click the Display gene table at
the bottom of the screen. This will change the display to show a
list with individual alignment files as rows and summary statistics in
the different columns.
Note that, due to performance issues, only the first 50 alignments are
shown by default. You can increment the number of shown alignments by
scrolling to the bottom and clicking the Show more 25 button.
Alternatively, you can export this data into a .csv file that can be read
by LibreOffice or MS Excel by clicking the Export as table
button.
As in the previous section, there are three main summary statistic categories , which are color coded along the table for convenience. A legend of each summary statistic is provided at the top of the table.
Sorting and filtering
Each column in this table can be sorted in ascending or descending order, which makes it easier to identify alignments with higher missing data or higher variation, for example. Let’s try to sort our table in descending order by the missing data (M) column.

The table now displays the alignments with higher amount of missing data. If
you want, you can filter alignments using the Search field above the
table. We could search for alignment names containing the string 279 by
typing it in the search field and pressing Enter.

As you can see, the table is still sorting the alignments by the missing data (M) column, but only for alignment names containing ‘279’. You can play quite a bit with the sorting and filters to obtain more information about your data.
To switch to the overall summary statistics view, click
the Display overall table button.
Displaying summary statistics
At any time, you can return to the summary statistics display by clicking the Summary statistics icon button at the edge of the Statistics’ side panel.